How do fashion trends emerge evolve over time? Why were dresses with rectangular silhouettes all the rage in the 1920’s, followed by dresses with defined waists in the 1940’s? One theory is that some trends in fashion are influenced by trends in the economy. Specifically, the “hemline index” theory posits a connection between the economy and skirt lengths – skirts have gotten longer during some economically troubling times (such as the Great Depression) and shorter during some prosperous times (such as the 1920’s and 1960’s) 1.
This theory hasn’t held up well to the evidence. For example, skirt lengths also fell during the post-WWII boom in the 1950’s. The evidence is particularly thin for the original idea that hemlines are a leading indicator of economic conditions. There is some evidence that suggests that skirt lengths may lag recessions, rather than the other way around, but I only found one paper to support this 2.
In spite of the spotty evidence for the hemline index, a connection between economic tides and fashion seems plausible to me. News about the economy seems to flood headlines, and some indicators of economic well-being – particularly the stock market – seem to be particularly susceptible to “vibes” 3. This made me wonder about the oversized or boxy clothing trends that have emerged over the past 5 or so years. Does the popularity of oversized clothing reflect our current economic conditions?
How might the economy affect fashion?
I don’t think that it’s controversial to suggest that culture influences fashion, and the economy makes up a large part of a culture’s zeitgeist. So I started this post with the hypothesis that poor economic conditions drive interest in oversized clothing. But what’s the mechanism by which a bad economic state might drive people to buy more oversized clothing (or longer skirts)? This is pure speculation, but to me the most plausible mechanism is an emotional one: people feel more anxious during times of high unemployment or a volatile stock market. This drives them to seek out clothes that are comforting and forgiving, such as voluminous sweaters or long skirts. If this is the case, we should expect to see that buying trends mirror economic trends, likely with some lag. For example, oversized clothing should become more popular after unemployment rises, and less popular after unemployment falls. The plot below shows a toy example of how this might look.
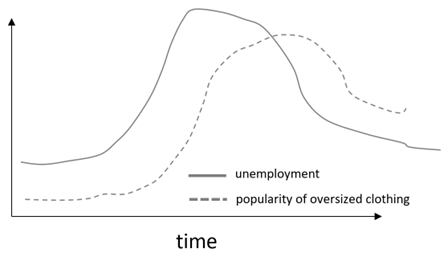
Hypothesis 1
Alternatively, economic conditions might merely drive the onset of a trend, but not its duration. Perhaps designers react to a recession by producing more oversized designs, because they assume that people will gravitate toward its emotional comfort value. This fills the market with oversized clothing, people buy it for its comfort value, but they discover that they like this trend on its own merits. Therefore, oversized clothing remains popular even as the economy rebounds. The plot below shows how the data might look if this alternative is correct: oversized clothing would become popular soon after an economic downturn, but it would endure even after the economy has recovered.
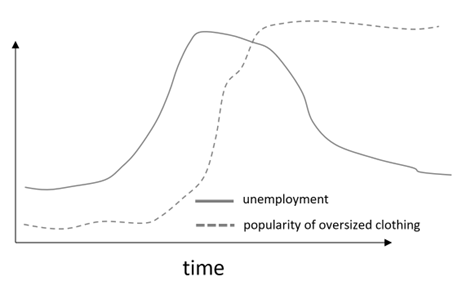
Hypothesis 2
So, do the data support a connection between the economy and oversized clothing? And if so, what’s the likely mechanism?
Measuring interest in oversized fashion
To answer this question, I first had to ask: how do you measure the popularity of oversized clothing? One method might be to gather purchasing data on oversized vs. non-oversized clothing. These data seem to be difficult to collect, though. You could identify oversized products with some web-scraping and looking for key terms (such as “oversized” or “cocoon”), but clothing companies don’t typically publish detailed sales data.
So instead, I turned to Google Trends 4. Google Trends measures the popularity of specific search terms over time, starting in 2004. If you assume that people are likely to search for clothing that they’re thinking of purchasing, this is a decent proxy for how interest in different types of clothing fluctuates over time. I started by searching for the popularity of google searches in the US for the terms “oversized” and “boxy” from 2004 through 2022. As a counterpoint, I also looked at searches for “skinny jeans” and “body con” during the same interval.
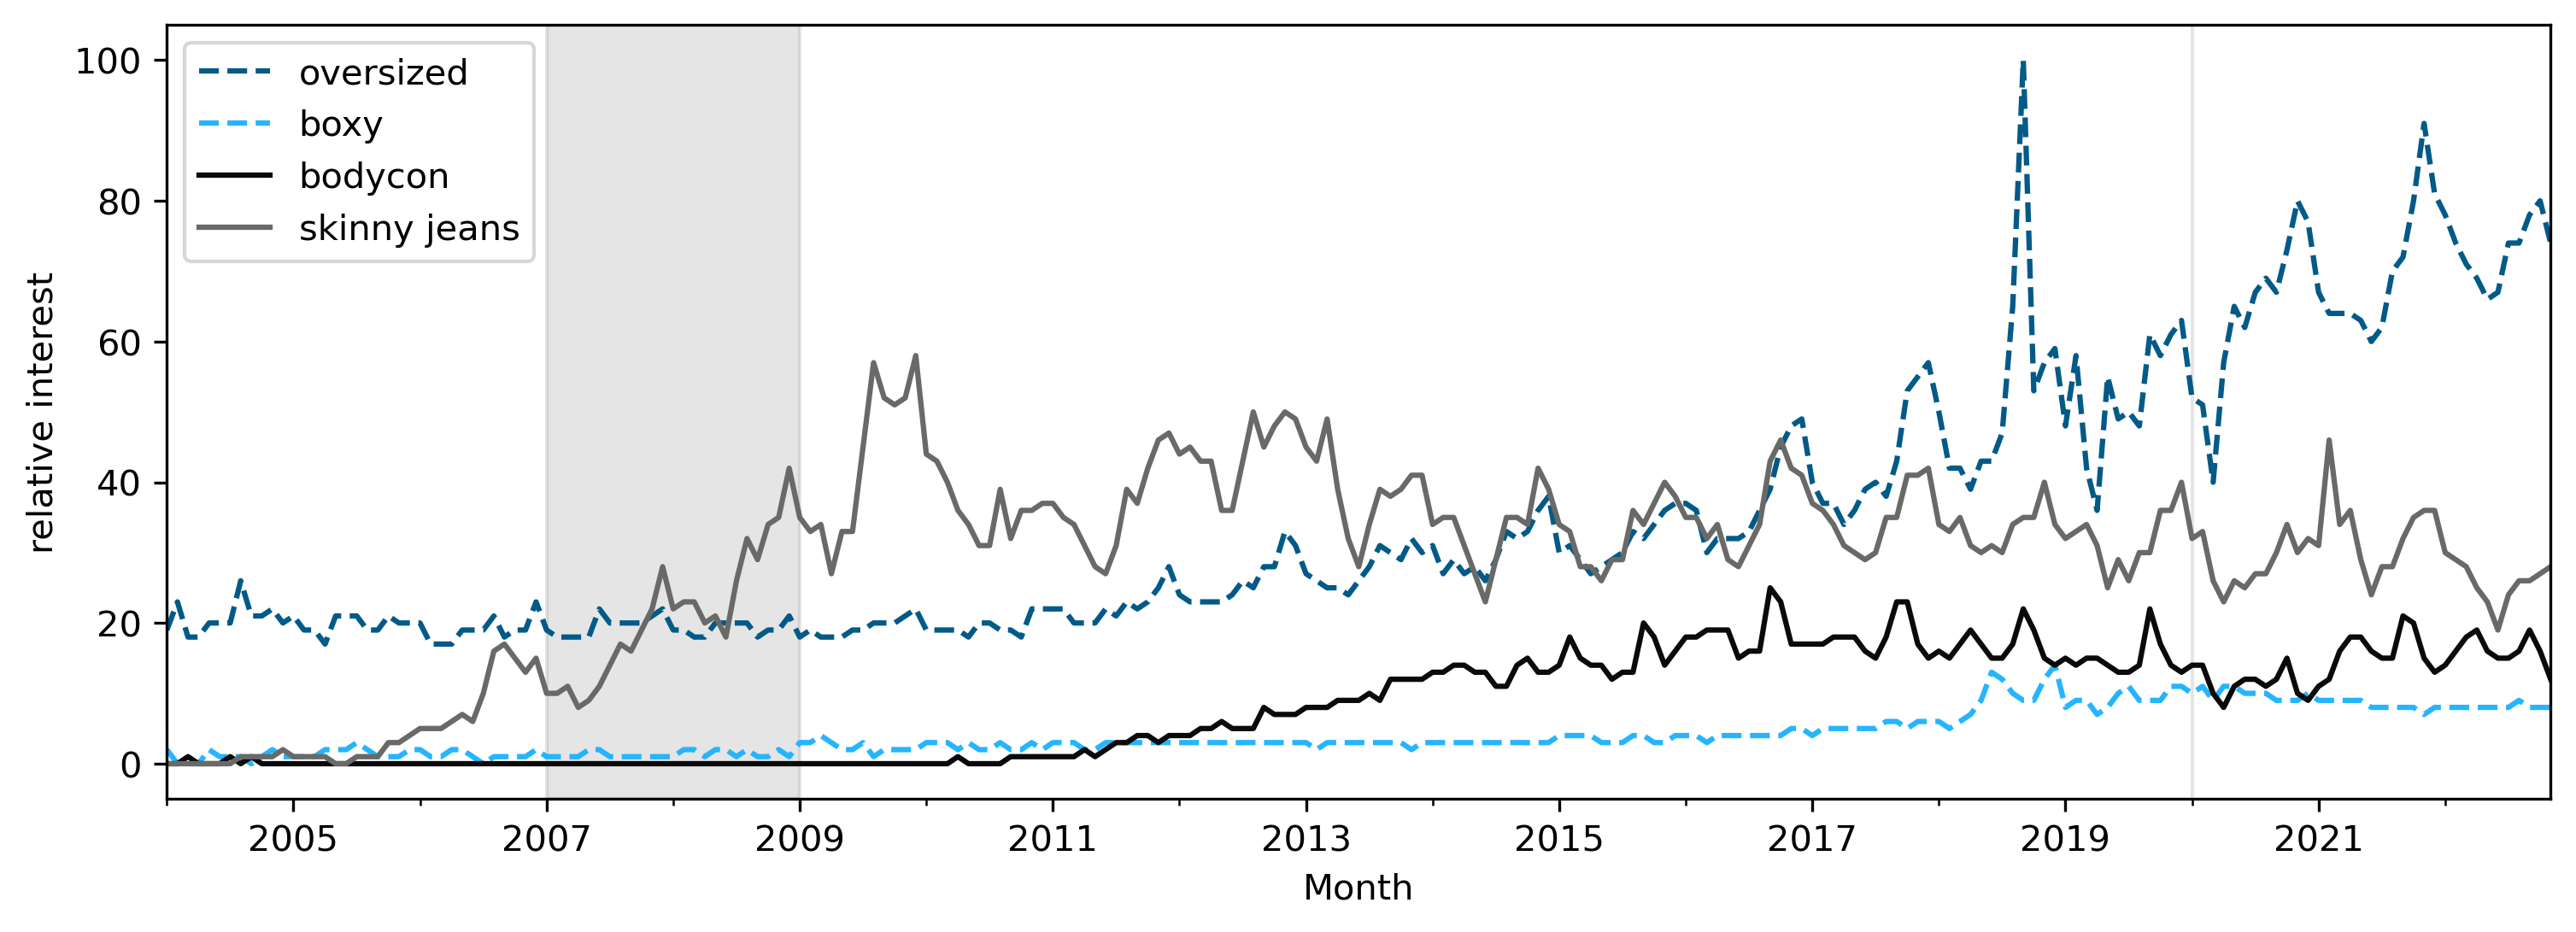
Here’s what I got 5:
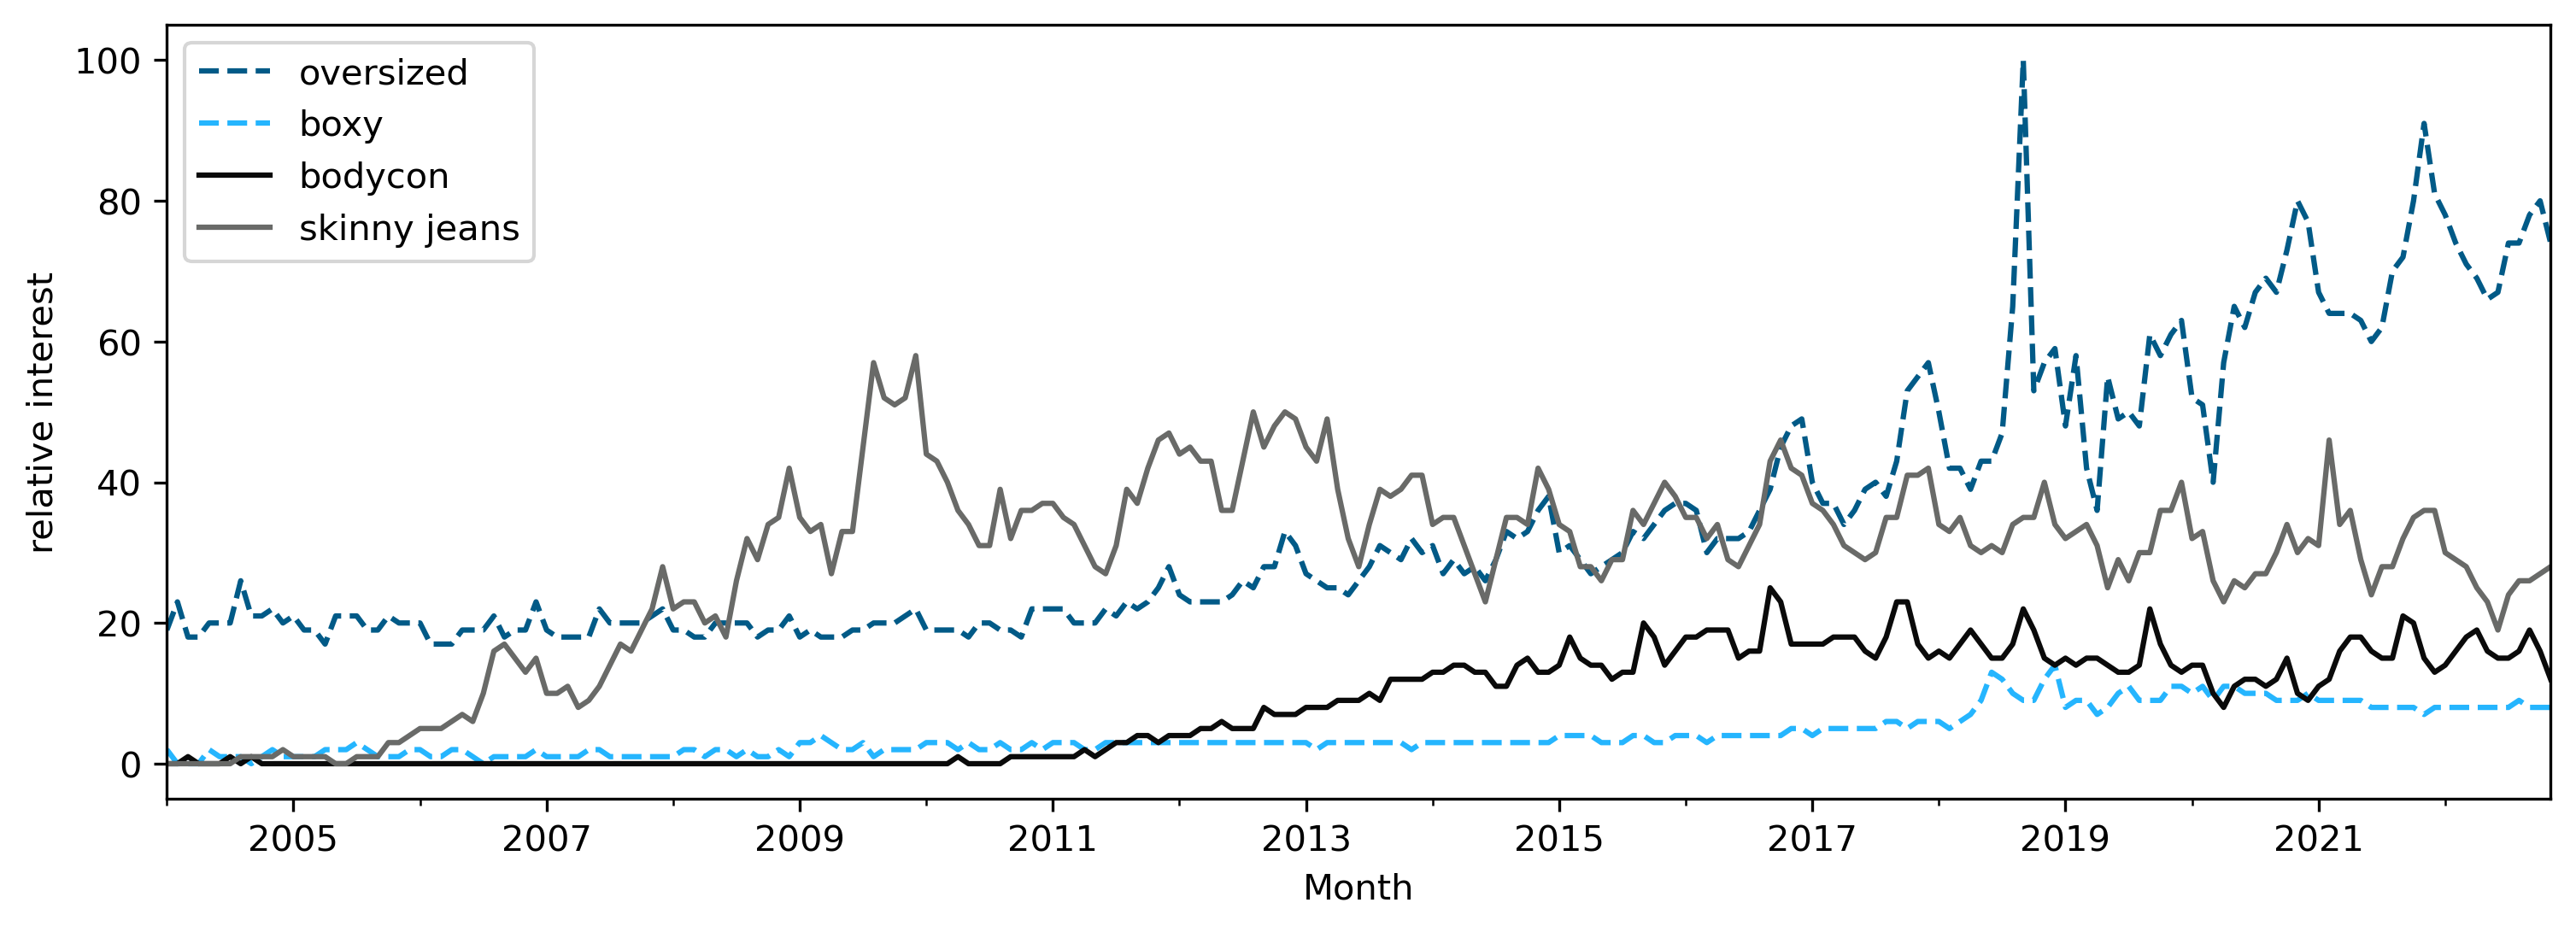
The y-axis here plots interest in each term, relative to the maximum interest both over this time period and among these terms 6. So, interest in “oversized” reaches 100% in September 2018 not because this was the only thing that people searched for on Google, but because this was the highest search rate observed for these terms, in this period.
As I expected (having lived through high school in the aughts), interest in skinny jeans started to register in the early 2000’s and then climbed through the beginning of the 2010’s. And, contrary to what I’ve heard from alarmed millennials who like to post about the end of skinny jeans on Twitter, interest in skinny jeans seems have held strong since then. There’s also a cool seasonality evident in this plot: interest in skinny jeans peaks in the fall and winter, and then falls in the spring and summer.
In an interesting contrast, “oversized” searches began to rise around 2011, and then dramatically surpassed “skinny jeans” around 2018. Here you might point out a flaw in my methodology – “oversized” is a broader category than “skinny jeans.” You can have oversized shirts, sweaters, dresses, or jeans, but you can only have “skinny jeans” jeans. So maybe it makes sense that interest in this broader category would be higher than interest in a narrower category like “skinny jeans.” This is probably true, and a more rigorous analysis would try to correct for the different category sizes. But my interest here was in getting a quick-and-reasonable dataset, rather than an optimally-rigorous one. I also think that this effect is mitigated by the fact that “skinny jeans” was once a much more popular search than “oversized,” even though it represents a narrower category. Given all of that, I think we can still learn something by looking at these relative trends.
So far, I’d confirmed my perception that fashion trends tended more toward form-fitting cuts in the early aughts, and more toward loose-fitting cuts in the past 5 years. But what caused these trends?
Adding in economic trends
Specifically, how does interest in these fashion terms line up with economic trends? Here come more methodological questions: how should I measure the health of the US economy over the past 20 years? There are many metrics to choose from. I started with unemployment numbers rather than NASDAQ points or GDP or purchasing power because unemployment seemed most likely to indicate how everyday people feel about the state of the economy.
Here’s what US unemployment looks like from 2004-2021 7:
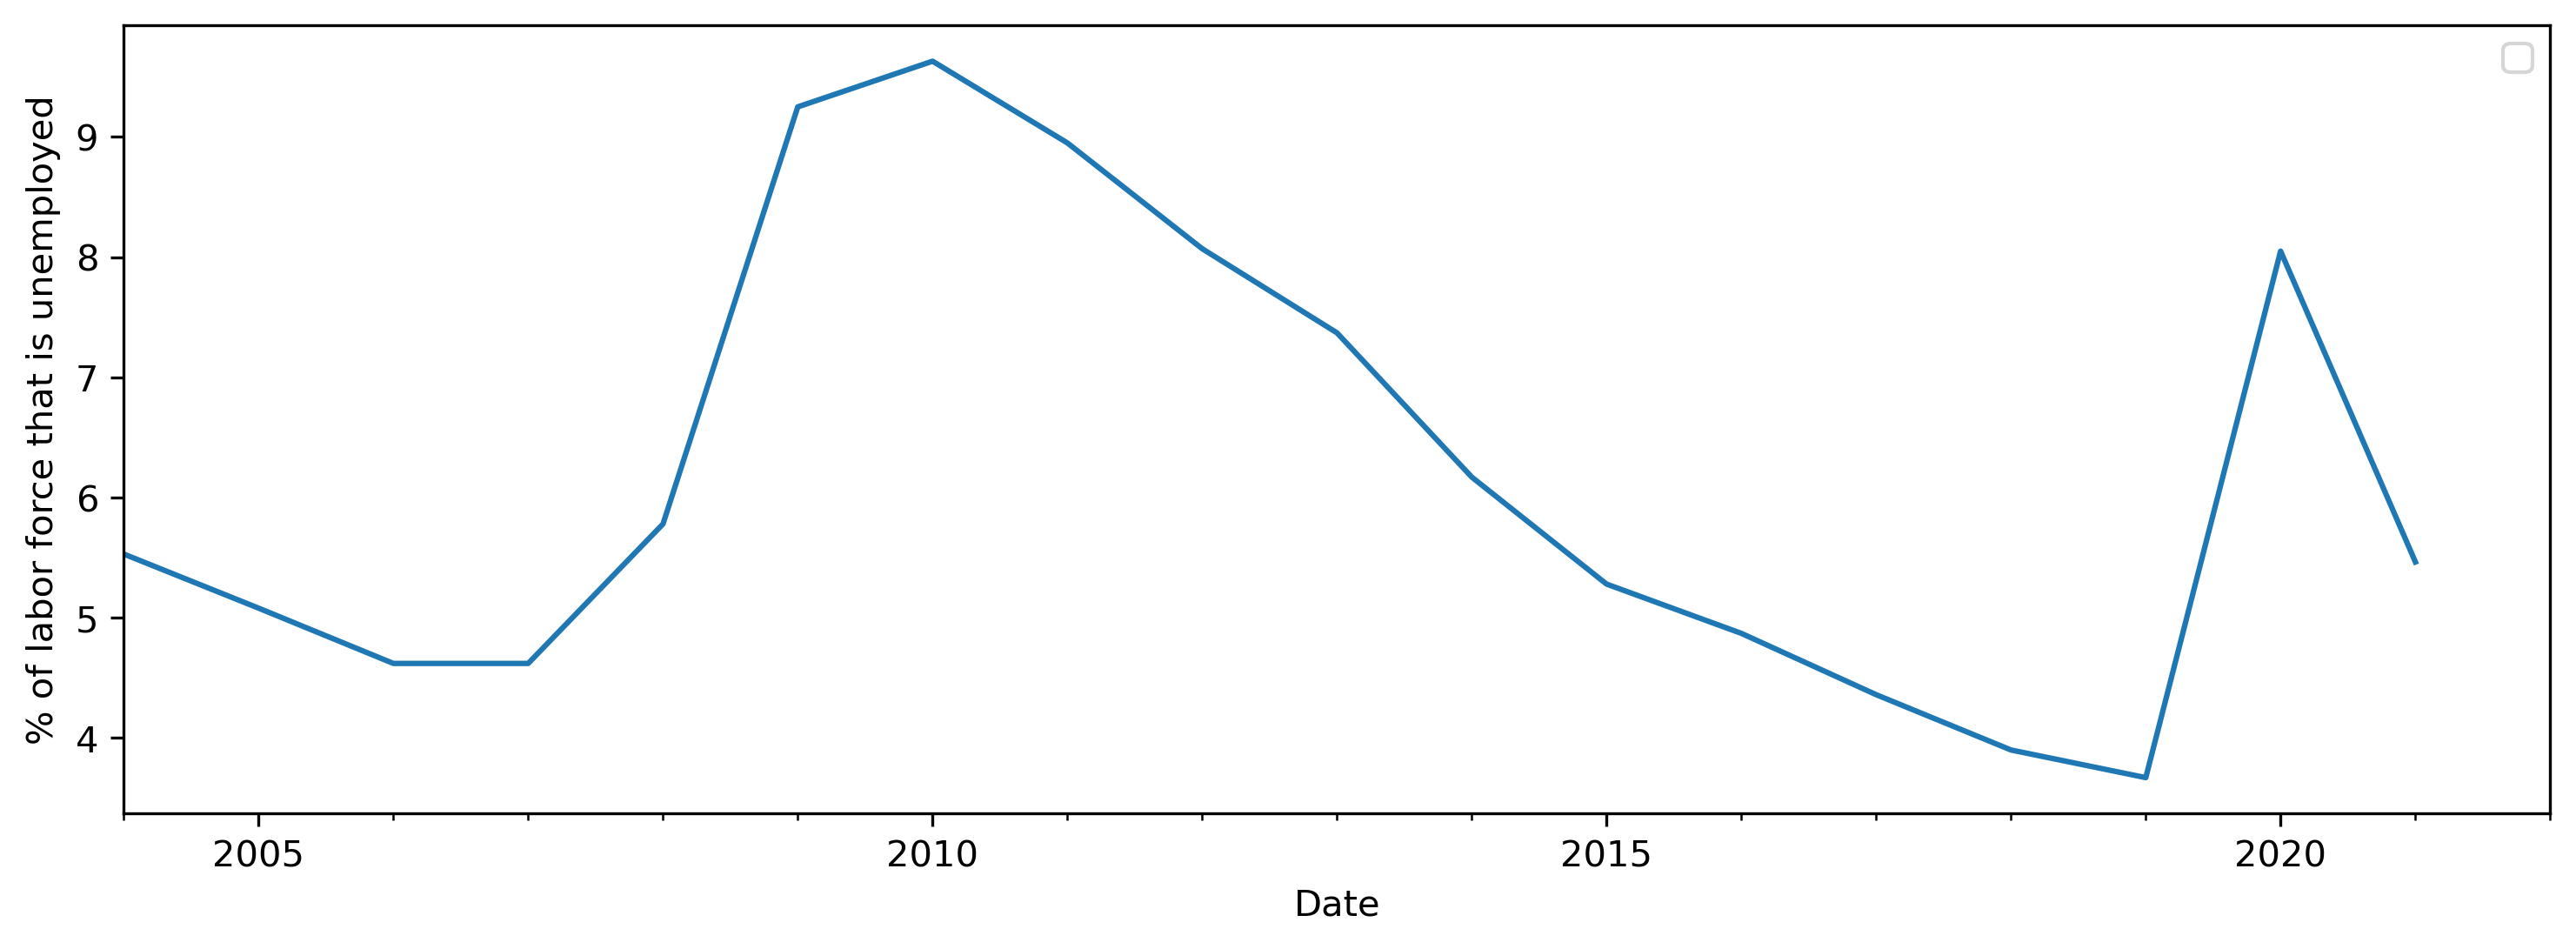
This plot shows that unemployment was relatively high from about 2008-2014 and again during the early days of the pandemic in 2020. If interest in oversized clothing is a reaction to economic downturns, I would expect that the Google trends plot would show an uptick in oversized searches starting sometime in the period from 2008-2014. Perhaps we should expect some lag while the fashion market adjusted, maybe up to a couple of years. So, if the popularity of oversized fashion was driven by rising unemployment, we might see evidence that the oversized fashion trend emerged around 2010. In fact, interest in “oversized” searches did begin to gradually increase around 2010. But there wasn’t a steep increase in those searches until 2018 or so, when unemployment had been steadily falling for several years. So, unless you posit that people gravitate toward comforting clothing in response to economic downturns with a roughly 8-year lag, this doesn’t seem like a plausible explanation for the oversized clothing trend.
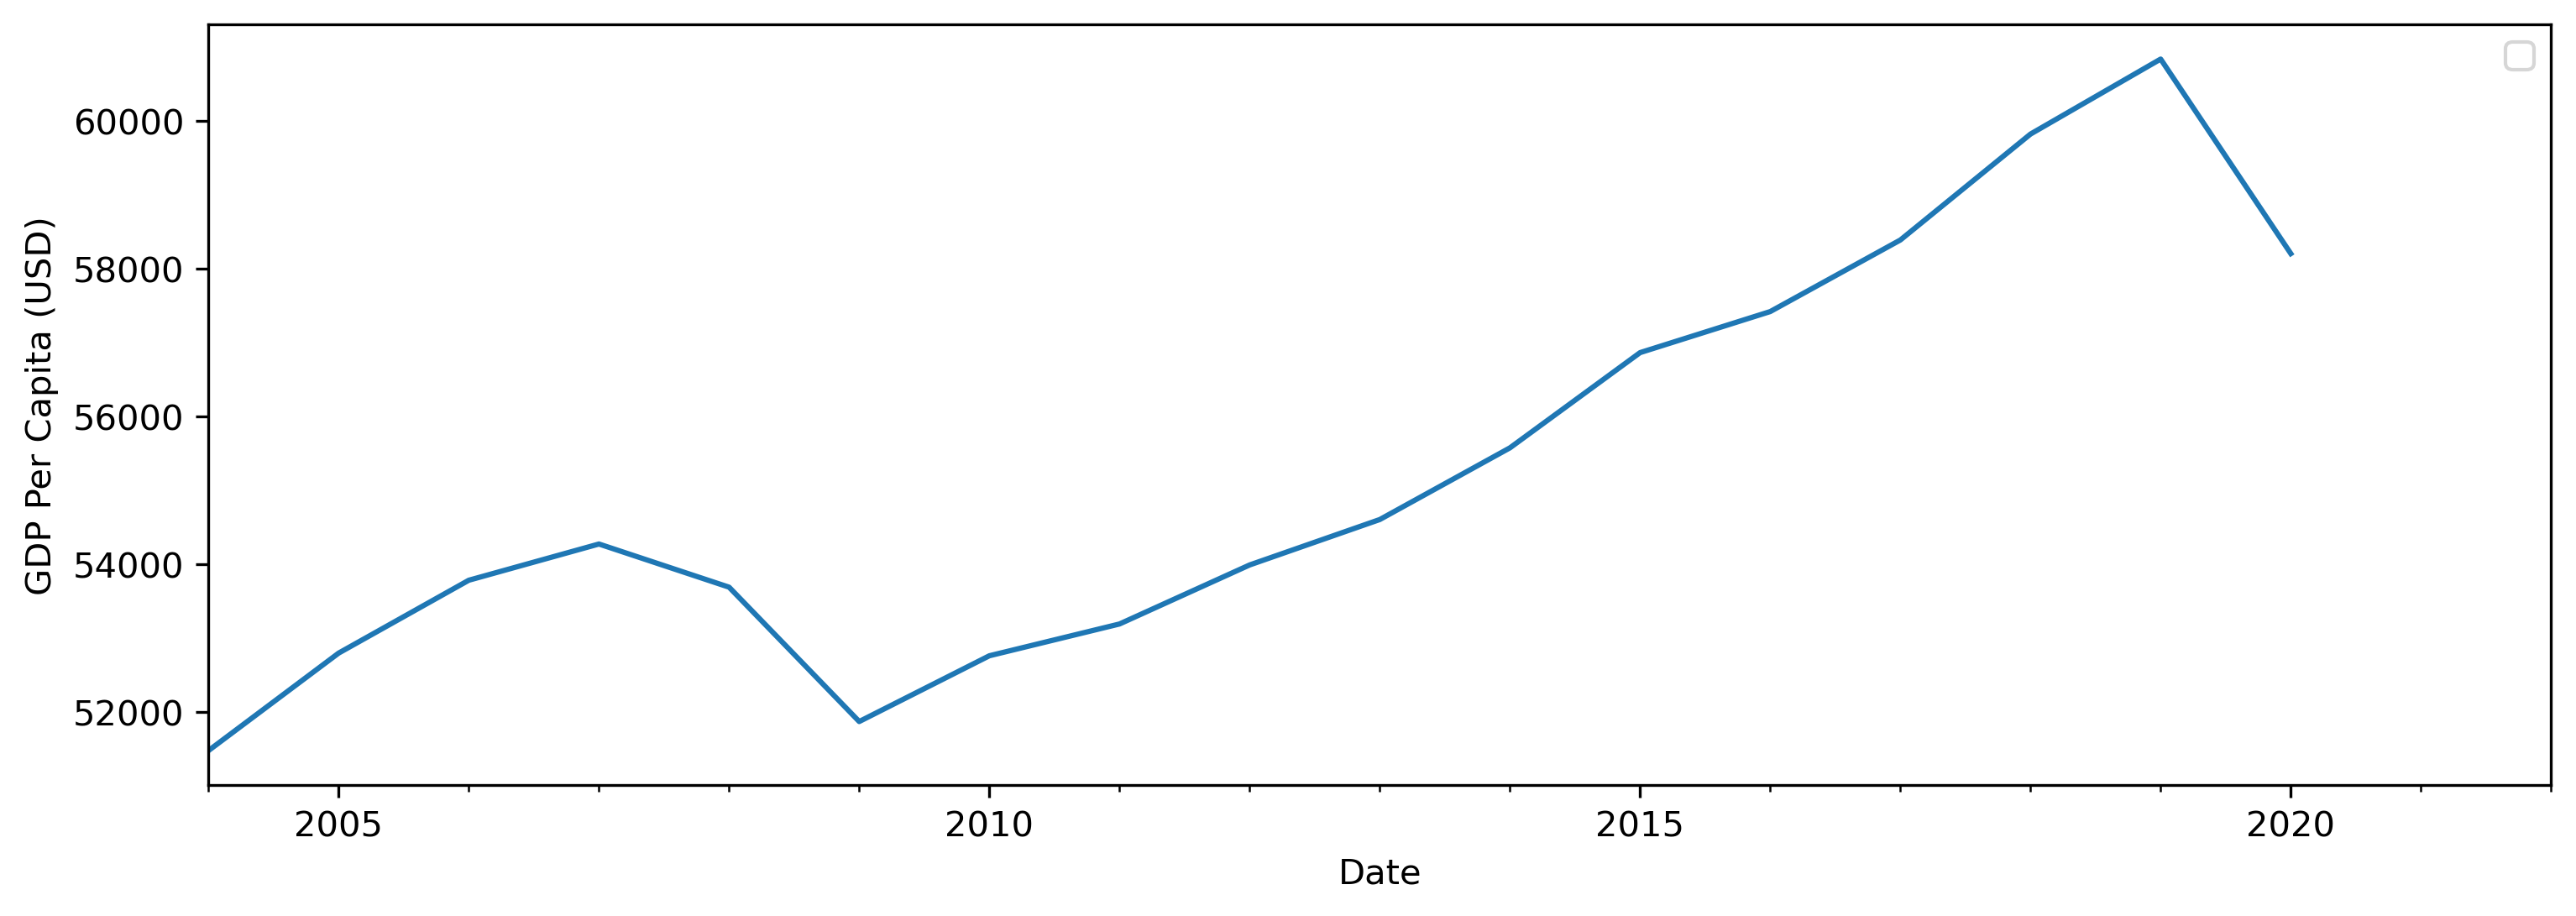
What about other indicators of economic well-being? I also looked into GDP per capita 8, wages 9, and recessions 10 in the US. GDP Per Capita steadily climbs from 2009-2020. So it’s unlikely that oversized fashion trends reflect concerns about economic productivity.
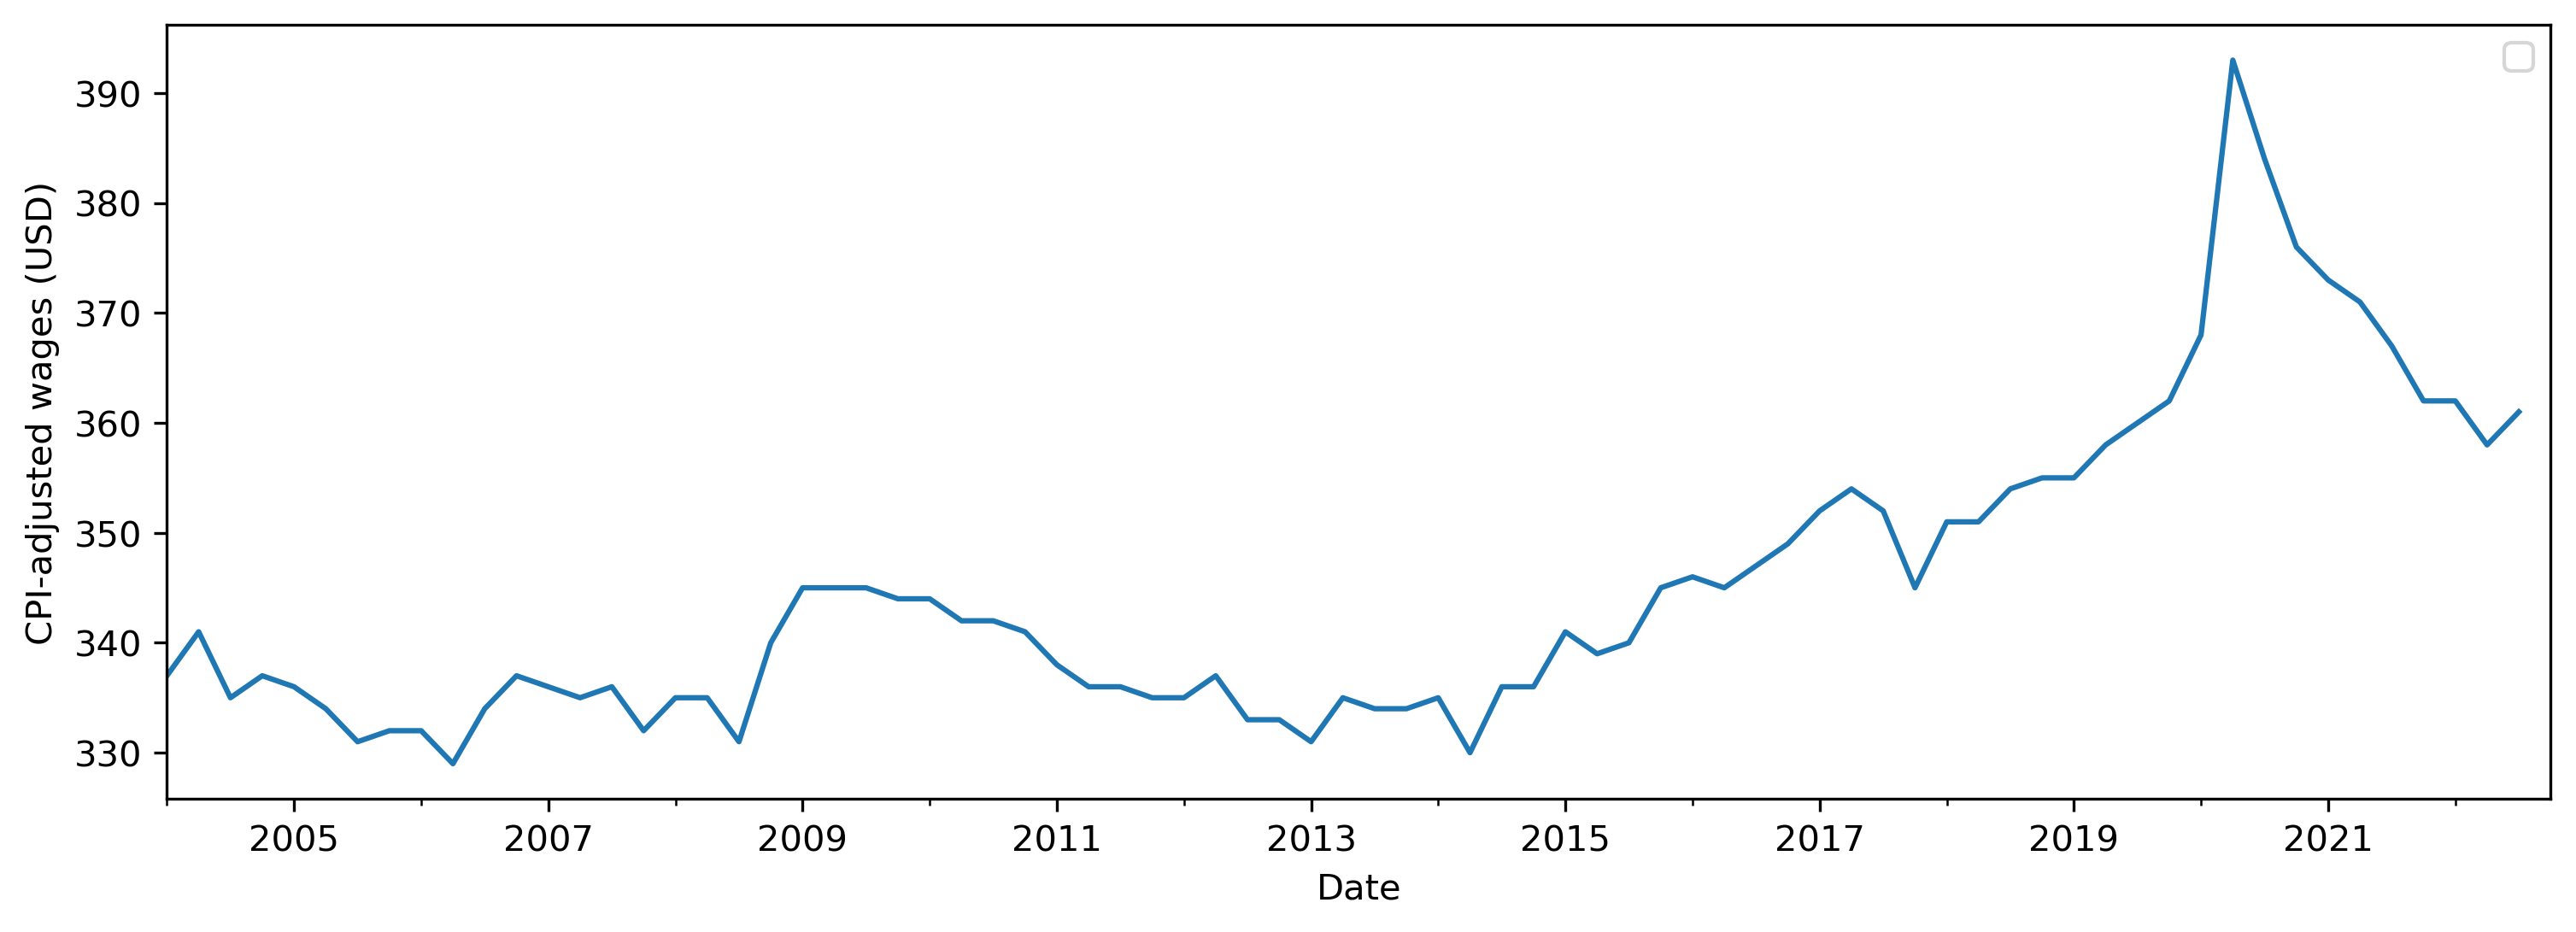
 What about individual earnings? Average real wages fluctuated a bit between 2004 and 2022, but generally rose from 2013-2020. So it’s unlikely that oversized fashion trends reflect concern about individual earnings.
 What about economic recessions? The National Bureau of Economic Research defines a recession as “a significant decline in economic activity that is spread across the economy and that lasts more than a few months” 11,12. Major recessions occurred twice during this period: from late 2007-June 2009, and from February-April of 2020. Interest in oversized fashion started to rise about 6 months after the first of these recessions ended but rose much more dramatically about 7.5 years later. So, it’s possible that this trend was a lagging reaction to the recession that really took off about 8 years later, but this just seems like too much of a lag to be plausible to me.
What about skirt lengths?
For good measure, I also looked at search terms more related to the original hemline index: “mini skirt” and “maxi skirt.”
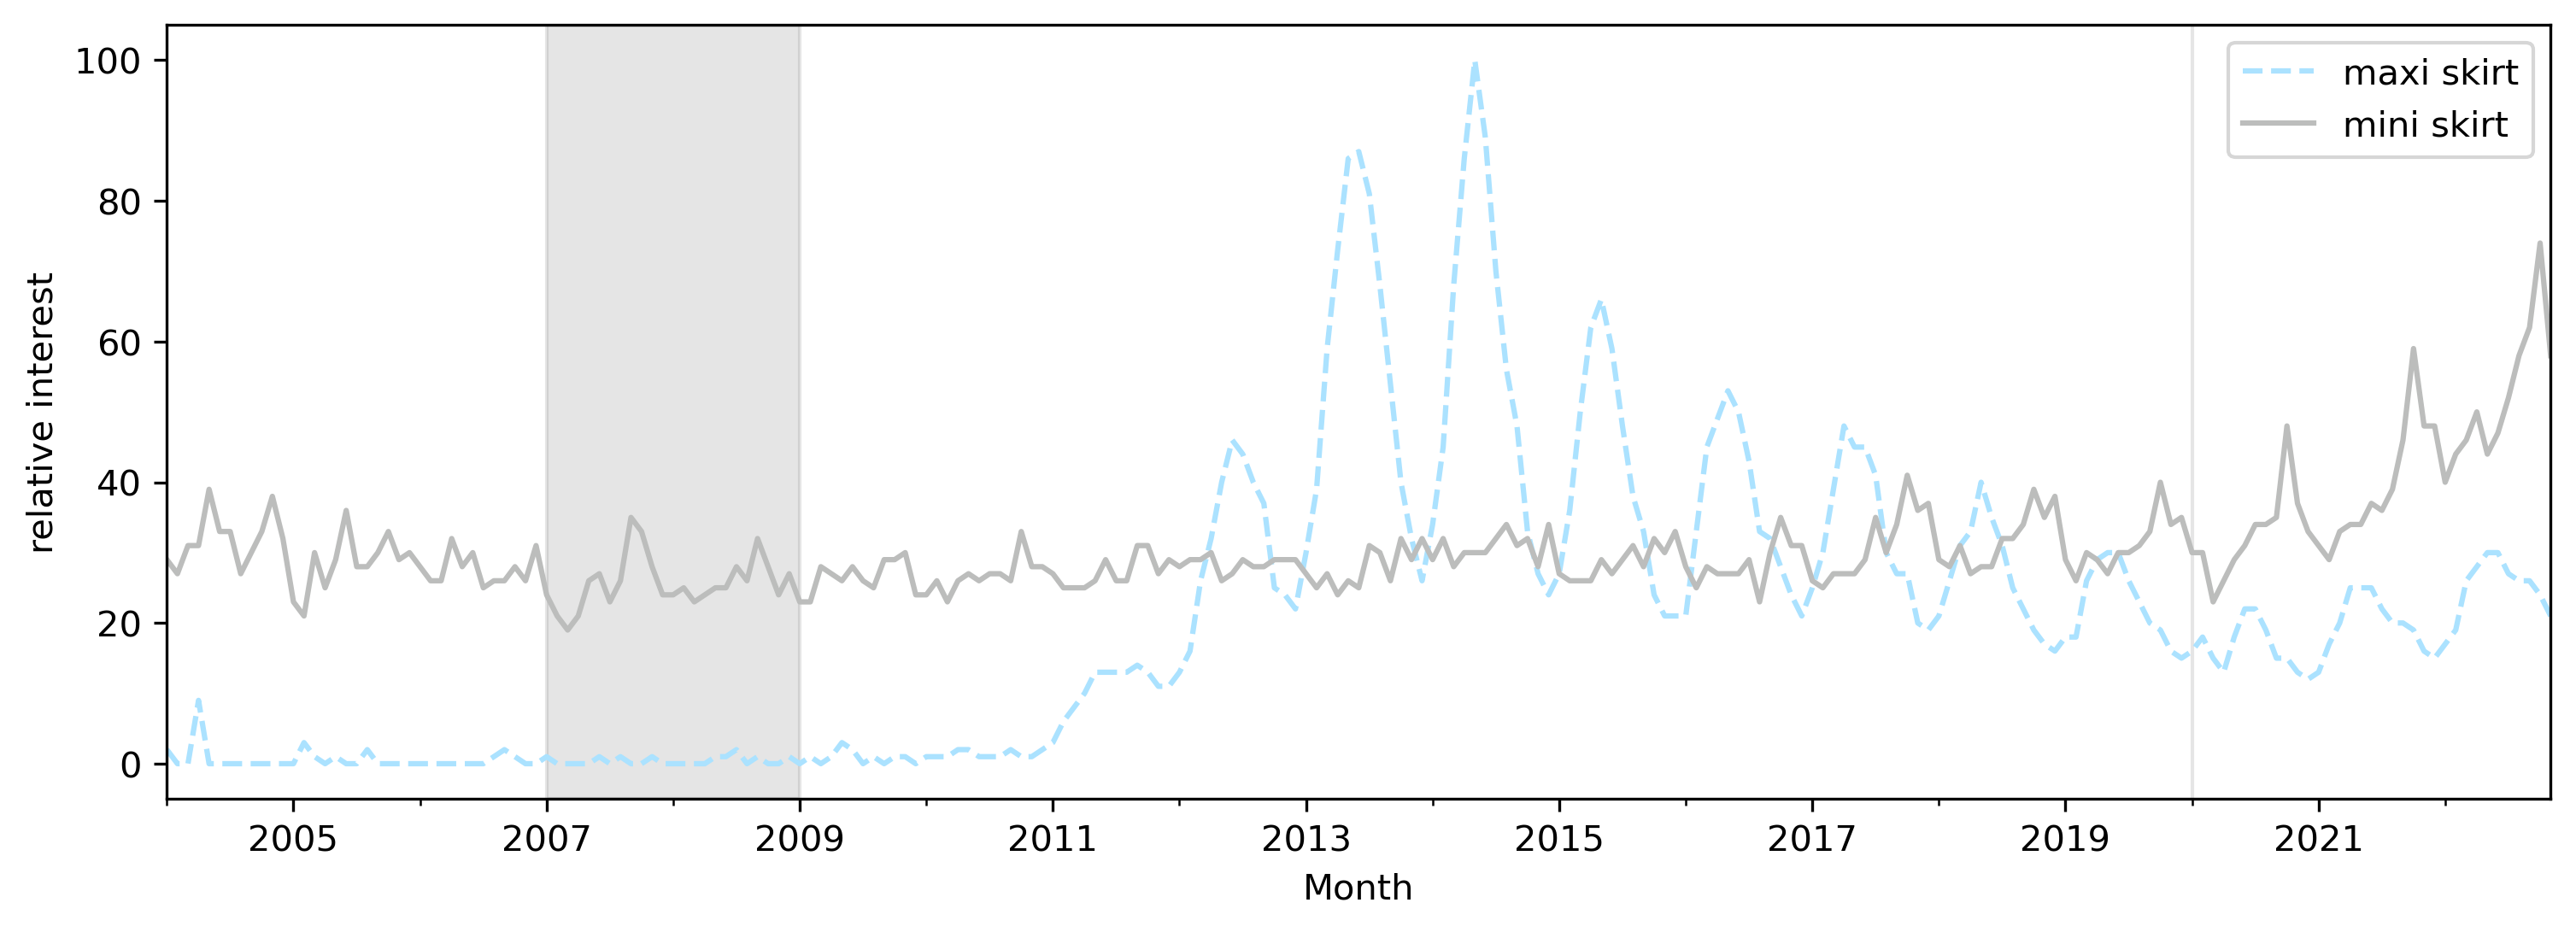
These terms showed a really interesting pattern, which I hadn’t expected. Interest in mini skirts seemed fairly stable from 2004-2020, with a noticeable uptick from 2020-2022. In contrast, interest in maxi skirts really only began in 2010, rose dramatically above interest in mini skirts from 2012-2017, and then tapered off from 2017-2022. Like skinny jeans, maxi skirts generate a very seasonal interest – they’re most popular in the summertime, when many women I know covet the swishy beach vibe. This on its own suggests that people may buy maxi skirts to conjure a fun, vacation-ready feeling rather than to cover themselves in comfort.
Looking at these data across the years, skirt length trends seem to map onto economic trends slightly better than “oversized” and “skinny” trends. Longer skirts became popular in a period with relatively high unemployment and became less popular as the economy improved. But, you definitely have to squint to make this mapping work, so I’m still not convinced.
Putting it all together
So, what story do these data tell? To make it easier to track these trends against each other, here’s a quick summary of the google Trends and economic data:
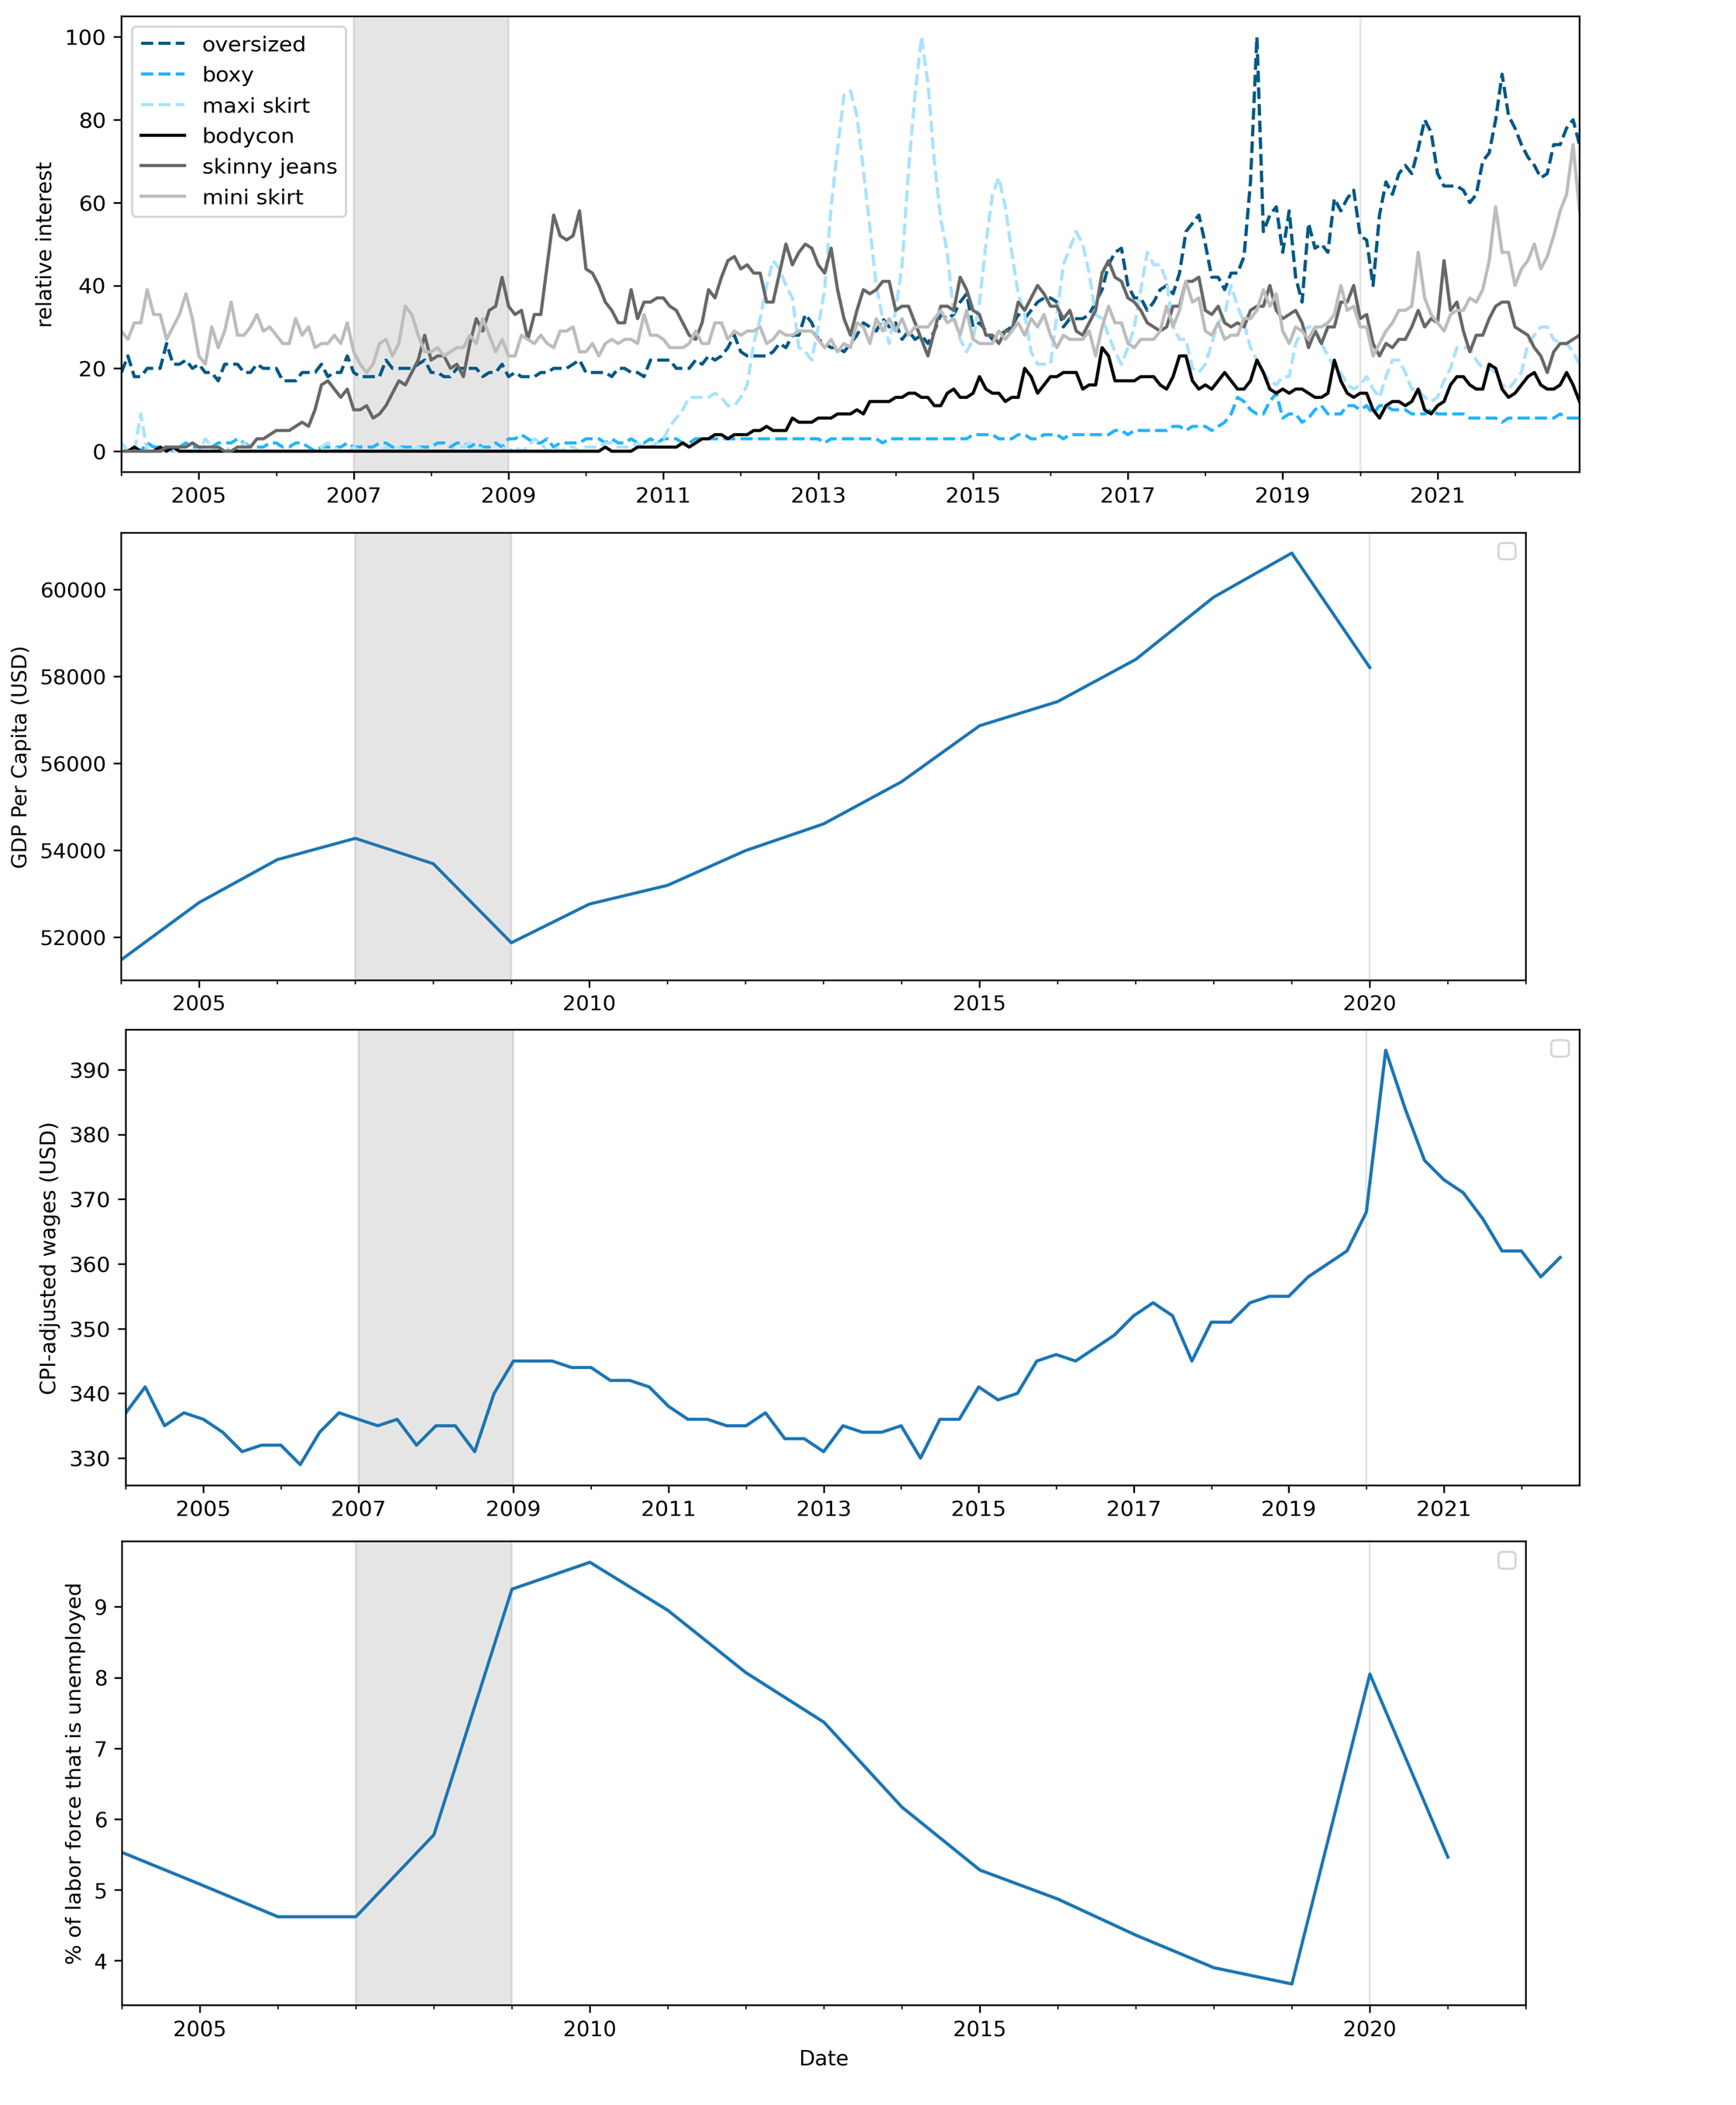
Looking across these plots, I don’t see a clear case that a poor economy yields more interest in oversized fashion. If anything, it might be the opposite – searches for “oversized” and “boxy” generally rose over a period when the economy generally improved, though the starting dates of these trends don’t really line up.
Instead, I think it’s more plausible that individual trends are caused by a more complex combination of factors. My non-expert hypothesis is that these include:
Economic zeitgeist (including some of the metrics shown above).
The drive for something new in fashion. For example, maybe oversized clothing became fashionable because skinny and body-con clothing had been popular for awhile, and people craved something different simply because novelty is exciting.
Textile costs and innovations. Perhaps in 2017 a new kind of weave or synthetic material was invented that makes oversized items drape in an appealing way that wasn’t possible before 2017.
Creativity. Designers are incentivized to generate new ideas (see “the drive for something new in fashion”). Some of these ideas are good enough to appeal to a broad audience, and these are the ideas that catch on. But exactly when these ideas occur to designers is somewhat random.
Changes in standards of beauty. Maybe the early aughts favored a curvaceous silhouette that was best highlighted by bodycon clothing, and now we’re going through a time when the ideal is more angular and gender-neutral.
Dependencies between commonly-paired separates. Some articles of clothing are frequently paired together, and maybe the frequency of these pairing evolves over time. For example, it’s now common to see skinny jeans paired with an oversized sweater. In my opinion, this can be a great outfit because the skinniness of the jeans balances out the shapelessness of the sweater. But this combination couldn’t have caught on unless skinny jeans were already a thing – so maybe it was easier for oversized clothing in general to catch on because we hung onto some of the body-conscious silhouettes of the 2010’s.
On a more methodological note, I was struck by the variability in these data. First, not all economic indicators track together. Wages & GDP track together pretty well, but unemployment lags these. This may point to differences in economic well-being across income levels, which have been a focus of a lot of recent economic research (e.g., 13). In addition, not all fashion trends track together. For example, searches for maxi skirts didn’t seem to track with searches for oversized or boxy.
This methodological observation leads to a more philosophical one, because this variability in the fashion trend data highlights the fact that fashion isn’t a monolith. Even if oversized looks are popular, that doesn’t necessarily mean that people prefer for all of their clothing to be oversized. Maybe some people prefer to vary the fit of items within a single outfit (e.g., skinny jeans and an oversized sweater, or a shirt tucked into a mini skirt). Or maybe others like to vary their outfit’s overall fit from day to day, or season to season. There’s probably also a lot of variability across individuals, which complicates the whole notion of “trends.” While some seek out oversized clothes, others still look to their skinny jeans. The fashion marketplace is large, it contains multitudes, and it serves a great variety of people who want to present themselves in a great variety of ways. And that is a beautiful thing.
Planet Money did an amusing episode on the idea of a “vibecession”↩︎
Note that there have been improvements in Google’s data collection method over time, which could cause discrete changes in the data. These happened in January 2011, January 2016, and January 2022. Google Trends’ explanation of the y-axis: “Numbers represent search interest relative to the highest point on the chart for the given region and time. A value of 100 is the peak popularity for the term. A value of 50 means that the term is half as popular. A score of 0 means there was not enough data for this term.”↩︎
Note that there have been improvements in Google’s data collection method over time, which could cause discrete changes in the data. These happened in January 2011, January 2016, and January 2022. Google Trends’ explanation of the y-axis: “Numbers represent search interest relative to the highest point on the chart for the given region and time. A value of 100 is the peak popularity for the term. A value of 50 means that the term is half as popular. A score of 0 means there was not enough data for this term.”↩︎
Unemployment data from Our World in Data↩︎
GDP per capita data from Our World in Data↩︎
Real wages data from The St. Louis Fed↩︎
A recent example: Chetty, R., Jackson, M.O., Kuchler, T. et al. Social capital I: measurement and associations with economic mobility. Nature 608, 108–121 (2022). https://doi.org/10.1038/s41586-022-04996-4↩︎