Running has been a friend of mine for a long time. This has been especially true during the pandemic – I can always lace up my shoes and go for a run, even if gyms are closed and yoga classes are canceled. Of course, not all runs are equal. Sometimes it feels like a slog, and sometimes it feels like I’m flying. Recently, I’ve become increasingly curious in digging into the factors that influence this variation in how my runs go.
To start off, I’m curious about the effect that the weather has on my running pace. A common piece of running lore is that you’re naturally slower when it’s cold out, because your body has to work to both warm you up and keep you moving. But, running itself warms you up pretty quickly (provided you’re dressed well). So maybe temperature doesn’t actually have much of an effect.
To understand whether there actually is a relationship between temperature and running speed, I decided to look at some of my own running data. Ideally, I would’ve pulled this information from a larger sample of runners, but I had trouble finding those data (likely for privacy reasons). So instead, I got some data off of my GPS watch. This means the data are noisier than if I had aggregate data, and more likely to be influenced by events that were specific to my running (such as training for specific races), rather than outside influences that would affect all runners to a similar extent.
Nevertheless, it’s a decent place to start. Since getting the watch in May, I’ve run roughly 3-6 days a week. For each run, my watch tells me the date of the run, how far I ran (in miles), how long it took me, my average pace (in minutes per mile), and my average cadence (how many steps I took per minute). Here’s the first few rows of my data, to get a sense for that:
##         Date Distance    Time Avg.Pace Avg.Run.Cadence
## 1 2021-01-16     6.51 0:58:35     9.00             164
## 2 2021-01-15     4.09 0:36:16     8.85             165
## 3 2021-01-13     6.51 1:00:33     9.30             162
## 4 2021-01-11     3.43 0:30:49     8.98             165
## 5 2021-01-09     7.41 1:07:09     9.07             167
## 6 2021-01-07     3.00 0:27:19     9.10             160
First, I decided to get a general sense of the data with a simple plot of my pace over time. While I don’t yet have a full year’s worth of data, I can still look for general differences between my running pace in the summer and fall-winter.
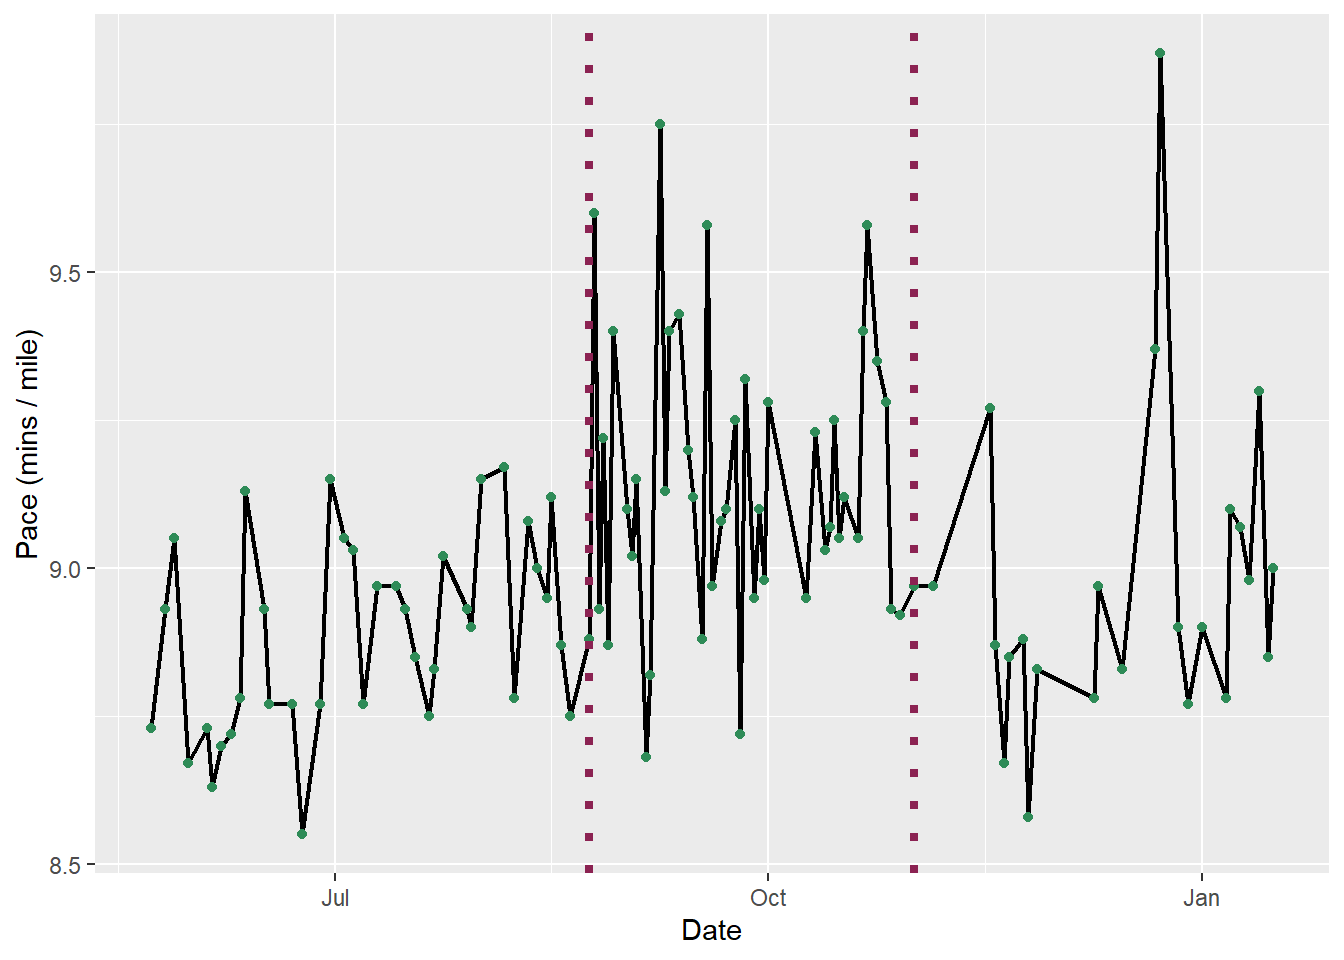
This plot suggests that I was a bit slower in the fall (and really slow one day in December right after a snowstorm, when I spent a lot of my run wading through snowbanks). But this isn’t necessarily because of the temperature – it could also be due to variations in how far I was running. In the fall, I ran a (virtual) half-marathon, and my training (delineated by the dotted lines) included a higher proportion of long-distance endurance runs than during the rest of the year. So most likely, these apparent differences reflect the fact that longer runs tend to be slower, rather than something about the change in the seasons.
But we can test this more directly, using historical weather data. I started by finding the minimum temperature for every day in 2020, using the National Weather Service’s archive. I chose to use the minimum daily temperatures because I tend to run in the mornings, which are roughly the coolest part of the day.
After a bit of formatting to clean up the dates and join it with my running data, the data look like this: for every run, I have the date, my distance, my average pace and cadence, and the low temperature for that day.
##         Date Distance    Time Avg.Pace Avg.Run.Cadence lowTemperature
## 1 2020-05-23     5.88 0:51:17     8.73             163             47
## 2 2020-05-26     3.87 0:34:34     8.93             161             50
## 3 2020-05-28     4.75 0:42:58     9.05             158             64
## 4 2020-05-31     6.23 0:54:01     8.67             164             50
## 5 2020-06-04     3.31 0:28:55     8.73             164             59
## 6 2020-06-05     5.08 0:43:51     8.63             167             64
So, was temperature related to my running pace? I started with a quick scatterplot:
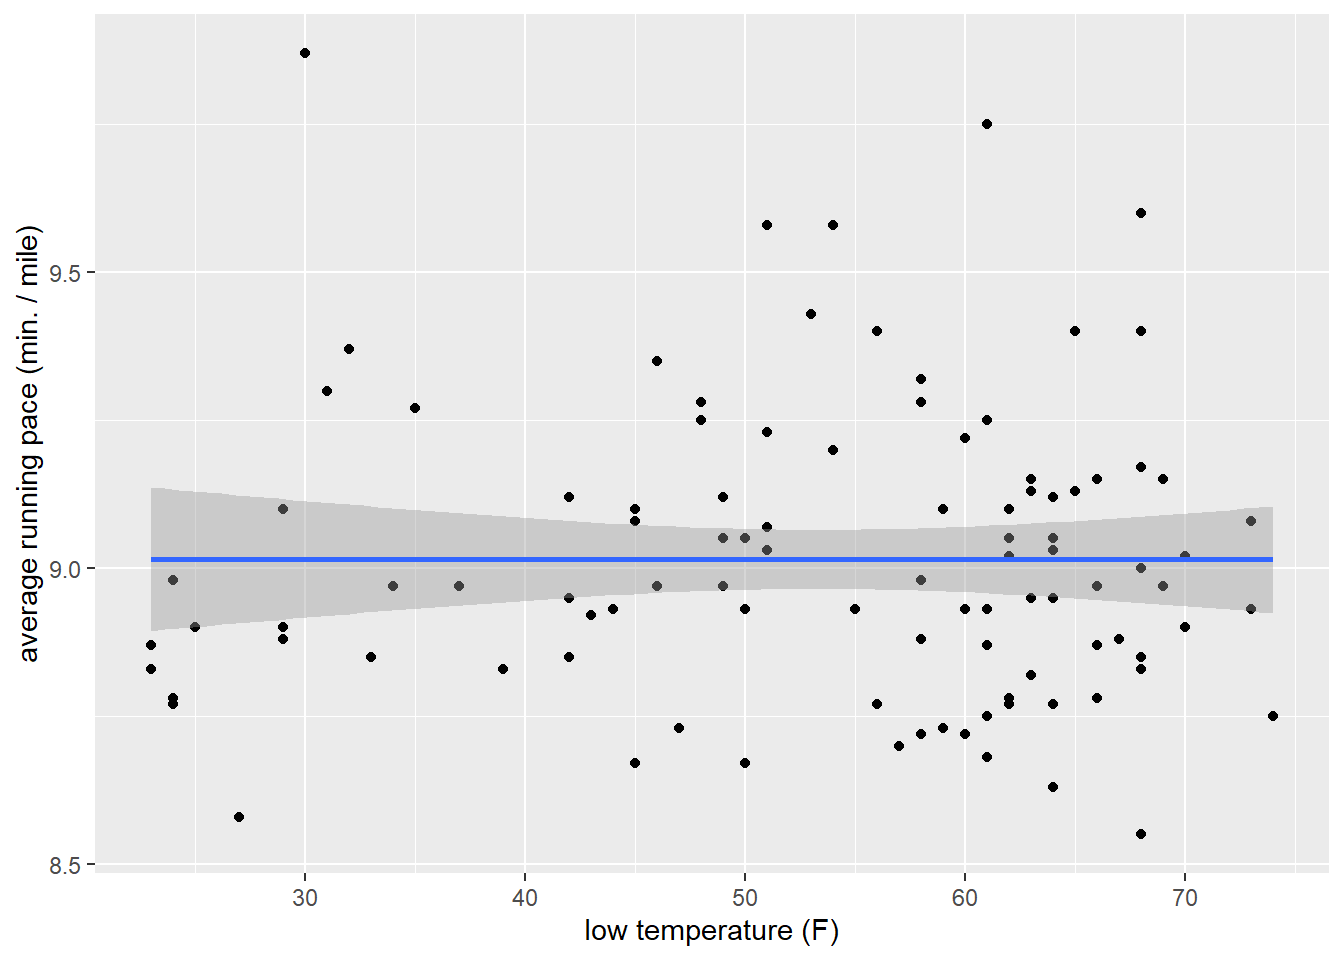
If temperature did make a difference in my running pace, I might see either a negative linear relationship or even a u-shaped curve. This latter pattern might emerge if heat also has a negative impact on my running (which seems anecdotally plausible, particularly when running in a mask!). However, so far there really doesn’t seem to be much of any relationship between my pace and the temperature. This doesn’t necessarily imply that there is no such relationship in reality – it’s possible that I simply don’t have enough data during the cold months to see such a trend.
However, it might also make sense to consider a more complex model of how my runs vary. Another aspect of winter weather that might affect running speed is how much snow and ice are on the ground. It’s possible that the running lore is half right – people are slower in the winter, but it’s because they’re slowing down to navigate half-cleared sidewalks. I’ve certainly gone out with the intention of doing a speedy interval workout, only to end up doing a slow-and-steady run because I had to slow down for icy patches along my route. It’s hard to measure sidewalk conditions per se, as these vary by route and the quality of your neighbors. But, I decided to take a shot at a proxy for the sidewalk conditions: recent snowfall. For this, I again pulled some data from the National Weather Service:
##         Date Snowfall (in.)
## 1 2020-01-01            0.0
## 2 2020-01-02            0.0
## 3 2020-01-03            0.1
## 4 2020-01-08            0.1
## 5 2020-01-09            0.0
## 6 2020-01-10            0.0
With those data in hand, the next step was to try to infer when there’s still snow and ice left on the ground. As a heuristic, I decided to assume that there might still be significant snow and ice on the ground if it’s snowed in the past week. This is certainly an imperfect heuristic, mainly because the actual road conditions depend a lot on individual people’s shoveling practices. In many cases, a poor shoveling job means that the sidewalk remains obstructed for much longer than a week – I’m still dodging icy patches that were formed a month ago! But, this kind of information is really route-dependent and my data simply aren’t that granular, so I think this is a reasonable estimate given my constraints.
Was my running pace noticeably slower when there was likely snow on the ground? Again, I started with a simple plot:
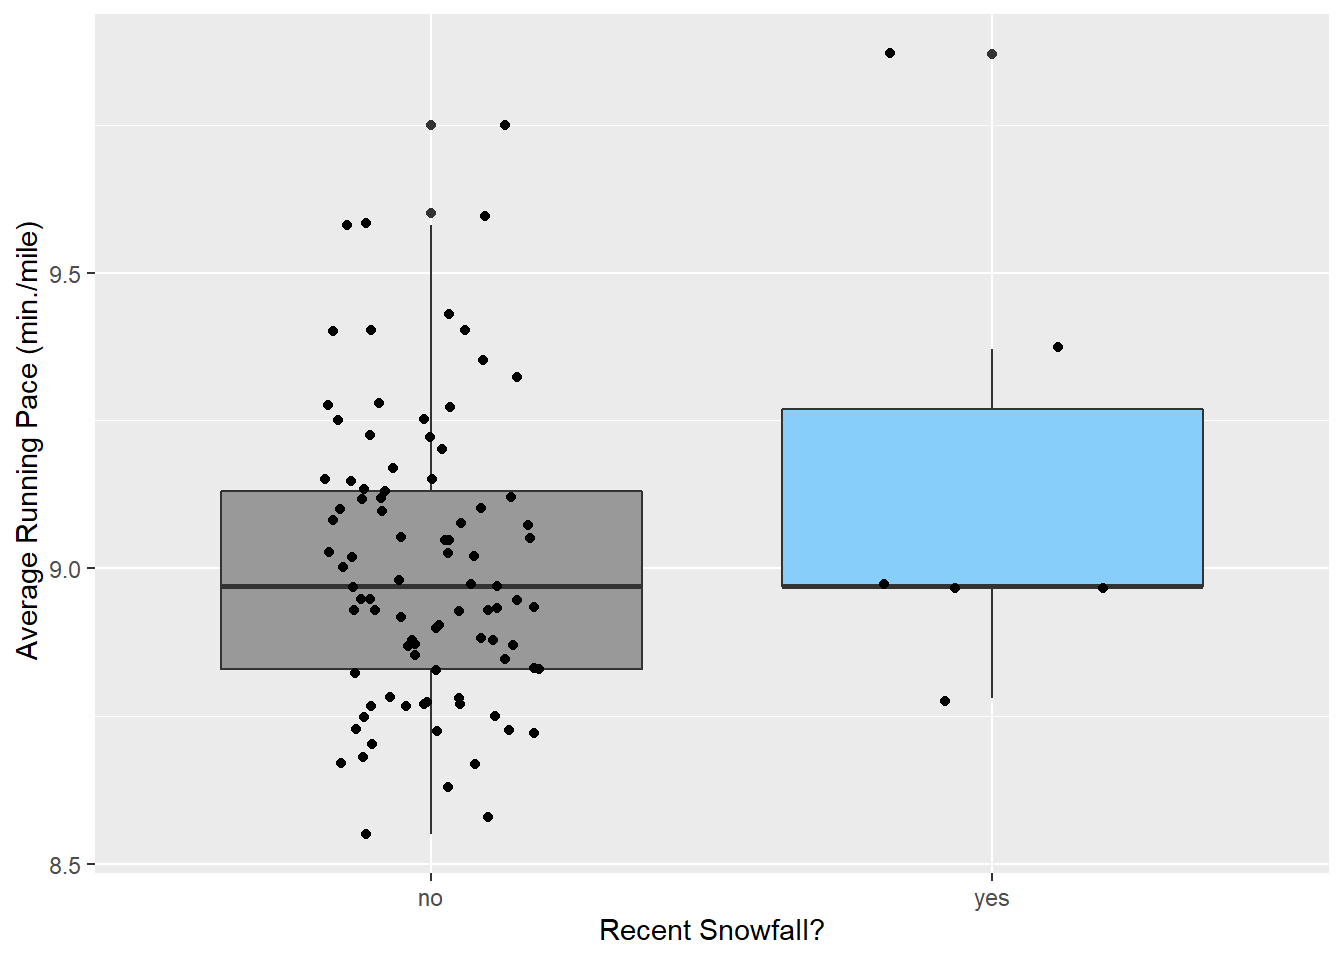
I think the answer is: maybe. One thing to note here is that I don’t have much data from days with recent snowfall (as you can see from the boxplot). However, this plot does suggest that I’m a bit slower when there’s probably snow on the ground than when there probably isn’t.
To put this all together, I ran a quick linear regression, using temperature and recent snowfall to explain my average running pace. I also included distance as a regressor, as I have a strong prior that that’s related to my pace.
## Regression Coefficients:## Estimate Std. Error t value Pr(>|t|)
## (Intercept) 8.709221483 0.148282483 58.733987 9.886950e-75
## lowTemperature 0.002033776 0.002163481 0.940048 3.496546e-01
## RecentSnowfallyes 0.147879563 0.114866958 1.287399 2.011847e-01
## Distance 0.036249957 0.013951417 2.598299 1.091049e-02##
##
## R-squared: 0.092The coefficients for temperature (‘lowTemperature’) and recent snowfall (‘RecentSnowfall’) are both relatively small and their p-values indicate that they’re not significant. However, the distance of my runs had a small-but-significant effect: when I ran further, I also ran slower.
This regression confirms that neither the ambient temperature nor the presence of snow on the ground had a measurable impact on my running pace. Of course, this doesn’t necessarily mean there is no connection between these weather events and my running: I don’t have much data from the colder months yet, and the data on whether there’s snow or ice on the roads is particularly coarse. So, I’ll be interested to revisit this analysis in a few months or next year, when I should have some more data available. But it’s also worth noting that together these 3 variables only accounted for about 9% of the variance in my running pace – meaning that there’s still a lot left to learn about what makes the difference between a slow-run and a flying-run.